Understanding
Data summarized in frequency tables can be used to determine the mean, median, interquartile range, and MAD.
What to look for
Be sure that students understand that the mean absolute deviation represents the typical difference of the data from its mean.Sample Assessment
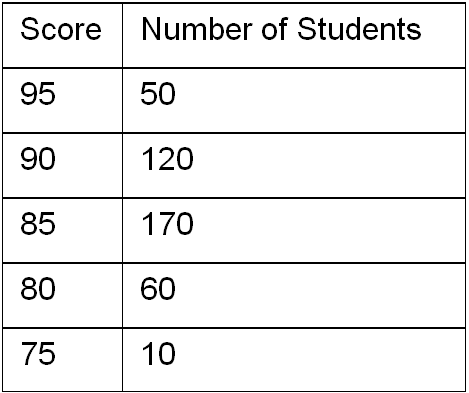
The table gives the test cores of a number of students.
What is the median score for the students?
Answer: 85


